Tides, Monsoons and Currents: The Science of Dive Timing in the Coral Triangle
Tide sets the hour, the moon sets the week and the monsoon sets the month. A month-by-month look at the wind and water that decide conditions across Sabah, Kalimantan, Sulawesi, Maluku and West Papua.
Dive conditions in the Coral Triangle run on two clocks. The fast one belongs to the Moon and Sun: it turns the tide twice a day and swings between large and small tides every fortnight, in every month of the year. The slow one is the monsoon, which reverses the wind twice a year and, with it, the swell, the rain and much of the surface current. The drift at a channel mouth on a given morning, or the chop on the boat ride out, depends on where both clocks happen to stand.
This article describes the usual pattern: what a month is typically like, and how the tide typically behaves through the fortnight. It draws on thirty-year averages and published research, not forecasts.
The fast clock: sun, moon and tide
Twice a day, but rarely the same twice
In most of the world the sea rises and falls twice a day, and each high water comes about 50 minutes later than the one at the same point the day before (Bowers and Roberts, 2019). The two tides of a day are seldom equal. A smaller rhythm with a period of one day runs underneath the twice-daily tide and makes one high water higher than the other, a difference called the diurnal inequality. In a few places the daily rhythm takes over and there is only one high water a day (Bowers and Roberts, 2019).
Which pattern a destination gets depends on where it sits. Ray, Egbert and Erofeeva (2005) describe the tides of the eastern archipelago and the neighbouring Pacific as mainly twice-daily but with a significant difference between the two tides, while west of about 118°E the tide becomes mixed and mainly daily, and west of Borneo almost wholly daily. The Sabah destinations sit close to that line: Lankayan at about 118°E, Sipadan and Mataking just east of it. From Lembeh eastwards to Triton Bay, the twice-daily tide dominates.
Springs and neaps
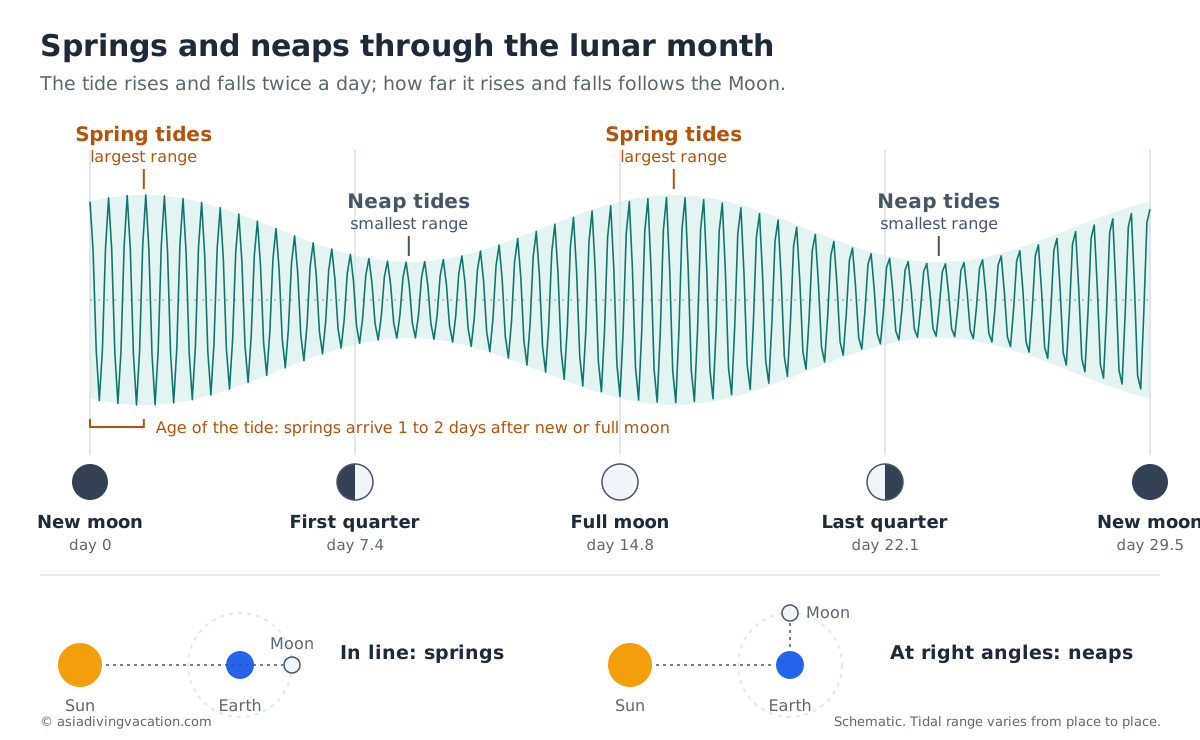
The size of the tide follows the Moon. Around new and full moon the Sun and Moon pull in line with the Earth, and the tides are at their largest: these are spring tides, which have nothing to do with the season. Around the quarter moons they pull at right angles, and the tides are at their smallest: the neaps. In most places the spring tides arrive one or two days after the new or full moon, a delay known as the age of the tide (Bowers and Roberts, 2019).
A larger rise and fall means more water moving in the same six hours or so, so the current through a channel runs harder at springs than at neaps. The year has its own rhythm on top: the twice-daily tide is at its largest around the equinoxes in March and September, so the spring tides of those months are among the biggest of the year (Bowers and Roberts, 2019).
Slack water does not always fall at high tide
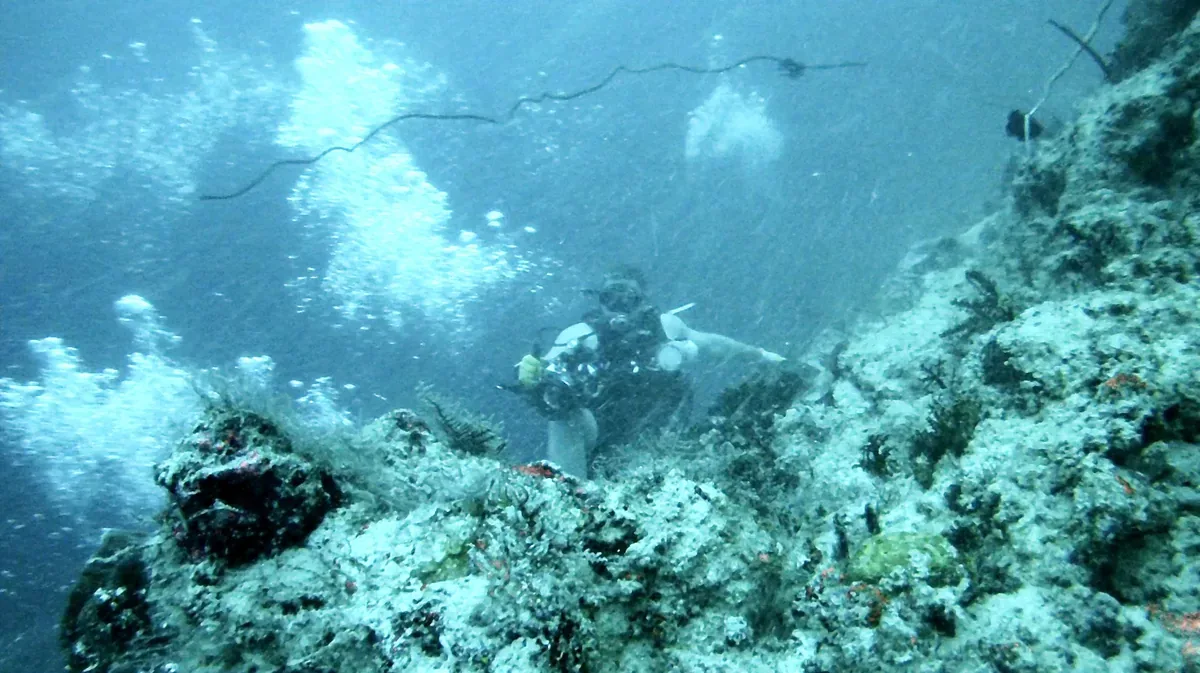
Where the tide behaves as a standing wave, sloshing back and forth in a basin, the current stops at high and low water and runs fastest in between. Where it travels along a coast as a progressive wave, the reverse is true: the current is fastest at high and low water and stops halfway between (Bowers and Roberts, 2019). Many places sit somewhere between the two. The Lembeh Strait is a measured example of the first kind. A current meter moored north of Serena Island in April 2016 found the flow falling to almost nothing at high and low water, and running at up to about 4 knots (7 km/h) for an hour and a half to two hours in between. A second meter about a kilometre away, between Serena and Lembeh Island, recorded almost no current at all (Yosi et al., 2023). A tide table gives the time of high water; it does not, on its own, give the time of slack water in a channel. That comes from tidal current predictions or from a guide who has dived the site through many tides.
The fastest tidal currents are found where a large volume of water has to pass through a narrow strait each tide (Bowers and Roberts, 2019). The Dampier Strait, the Patinti Strait, the Lembeh Strait and the channels around Maratua all fit that description.
Across the Indonesian seas, tidal currents mostly follow the shape of the seabed, with the fastest flows over shallow ground; the strongest currents in deeper water are found around Timor and in the Molucca Sea and its margins (Ray, Egbert and Erofeeva, 2005). Apart from Lembeh and the entrance to Ambon Bay, we have not found published measurements of tidal current speed or slack-water timing for the individual dive straits, which is one reason dive guides' local knowledge counts for so much there.
The Moon also times some events on the reef itself: coral spawning, plankton blooms and the movements of some fish. That is the subject of a separate article, moon phases and marine life.
The slow clock: the monsoon year
Every year the wind over the Coral Triangle makes two long sweeps and pauses twice in between. From December to March it blows out of the north, from June to September out of the south, and in the gaps it loses any settled direction. Which of those months suits a destination depends on which side of the equator it sits, and the line runs through the middle of our region: Sabah and Kalimantan are a few degrees north of it, Ambon and Triton Bay a few degrees south, and Raja Ampat sits almost on top of it.
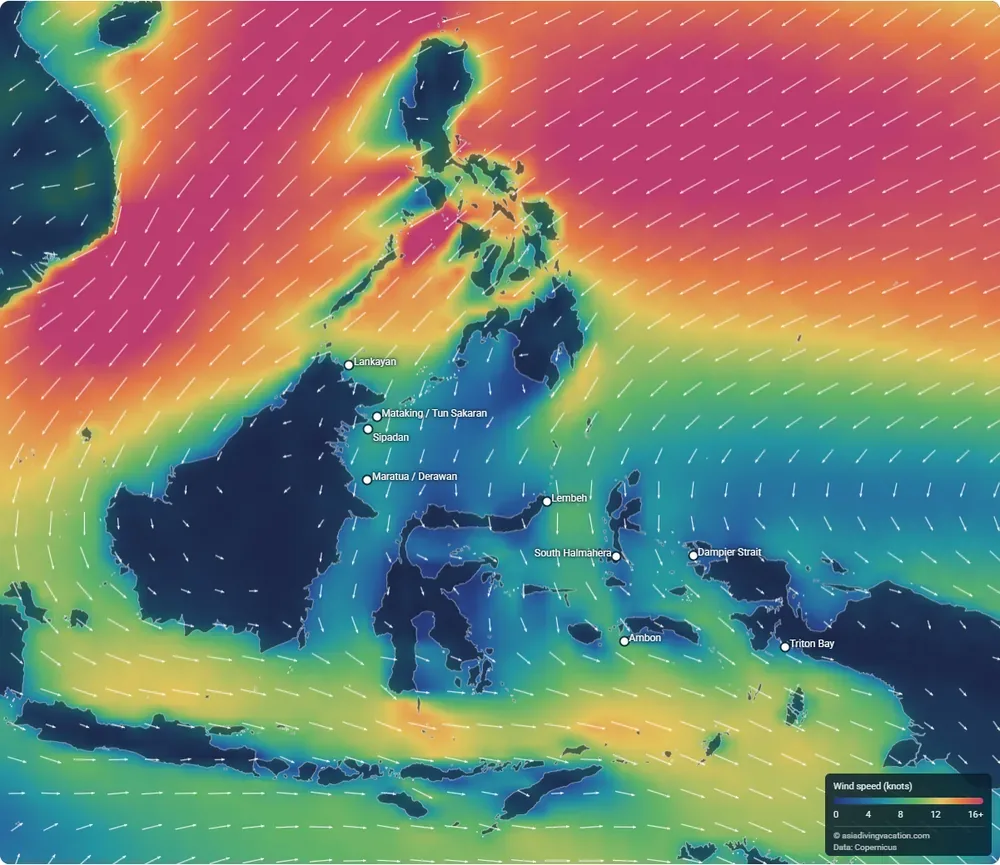
The map shows thirty-year averages: wind from the ERA5 reanalysis for 1991 to 2020, and surface currents and water temperature from the GLORYS12V1 ocean reanalysis for 1993 to 2020. It describes what a month is usually like; for the week of a trip, see the forecasts listed at the end of this article.
December to March: the northeast monsoon, bending northwest
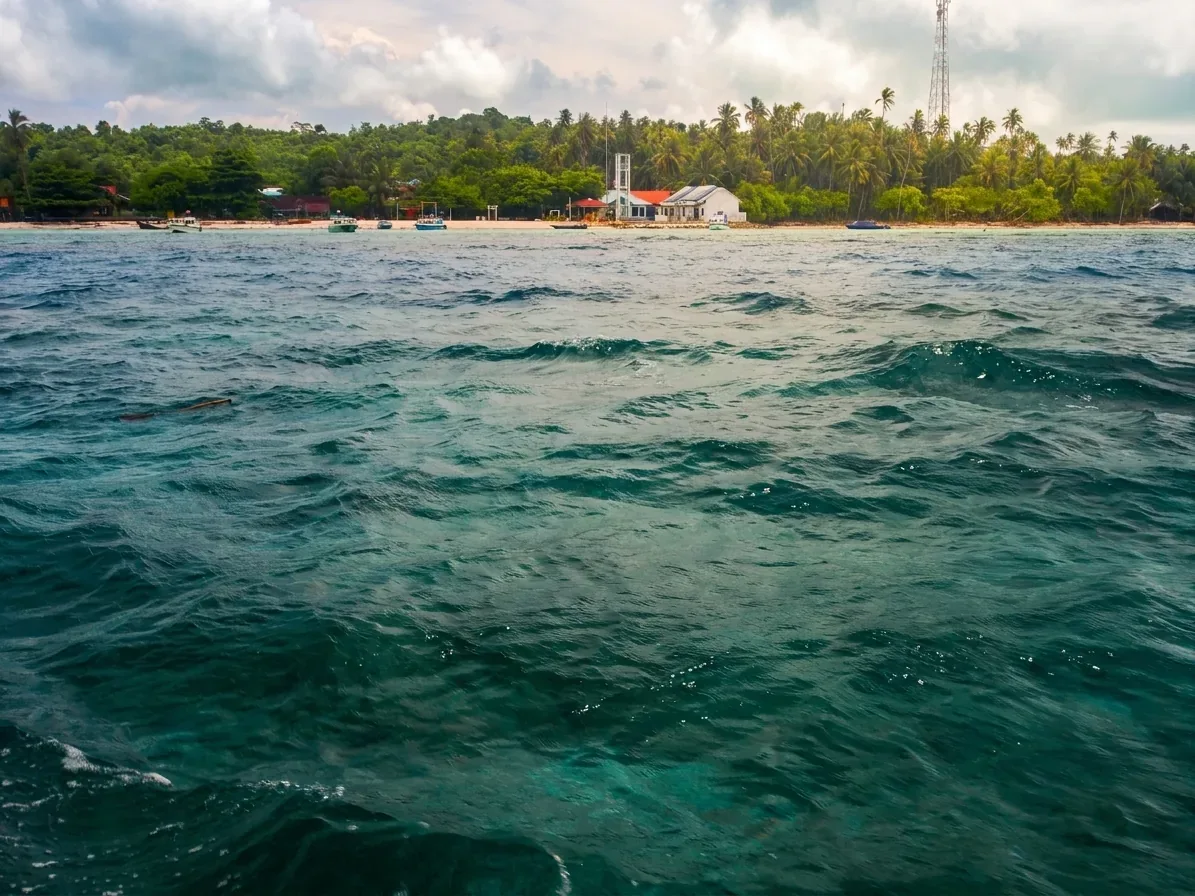
In the northern winter, cold high pressure over mainland Asia pushes air south across the South China Sea and the Philippines as the northeast monsoon. It is strongest north of Borneo. Lankayan, in the Sulu Sea, averages 8 knots (15 km/h) from the northeast in January and February, the windiest months of its year, and the island's only resort closes for those two months. Sipadan averages 7 to 8 knots (13 to 15 km/h) from the north and northeast over the same period.
At the equator the wind changes direction. Air crossing into the southern hemisphere is turned by the Earth's rotation the other way, so the same stream of air arrives in Maluku and West Papua from the northwest. Ambon averages 9 to 10 knots (17 to 19 km/h) from the northwest in January and February. Triton Bay gets about 5 knots (9 km/h) from the same direction, which is light enough for its dive season to run through the northern winter.
April and November: the changeover
Between the two monsoons the wind loses its direction before it loses its strength. In April the wind at Ambon still averages about 6 knots (11 km/h), but it comes from so many directions that, added up as arrows over the month, less than 1 knot (2 km/h) points any one way. In July Ambon averages 13 knots (24 km/h), nearly all of it from the southeast. Triton Bay follows the same pattern, and both have their changeovers in April and November.
North of the equator the changeover comes a month later in spring and earlier in autumn. At Sipadan and Maratua the wind is least settled in May and from October to November. At Lankayan, September and October are the least settled months.
A wind that keeps changing direction cannot build a swell from any one quarter, and it blows on average at about half the strength of the southeast monsoon at Ambon. These are the months with the best odds for open-water crossings and exposed pinnacles. They are also the months when the calendar says least about any particular day.
The changeovers do not line up with the whale shark season at Lankayan, which runs from March to May. March there still averages about 8 knots (15 km/h), mostly from the northeast; the sharks arrive as the monsoon eases, not after it has stopped.
June to September: the southeast monsoon, bending southwest
In the northern summer the pattern reverses. High pressure over Australia drives southeast trade winds across the Banda and Arafura seas, and these are the strongest winds of the year in the region we cover. Ambon averages 11 to 13 knots (20 to 24 km/h) from the southeast from June to August, and those are also its wettest months. Triton Bay averages 9 to 11 knots (17 to 20 km/h) and its resort closes for the season, reopening in late September.
North of the equator the same air turns again and arrives from the south and southwest, weaker. Sipadan averages 5 to 6 knots (9 to 11 km/h) from the south in July and August. The Dampier Strait in Raja Ampat gets 6 to 7 knots (11 to 13 km/h) from the south in the same months; Waigeo, Gam and Batanta shelter much of the strait, while Misool, further south and open to the trades, takes the full swell.
Lembeh shows why a grid square of open sea is not a dive site. The open Molucca Sea outside it averages 7 to 8 knots (13 to 15 km/h) from the south in August. The strait itself, between Lembeh Island and the mainland, is sheltered from both monsoons and dives normally all year.
Typhoon tails
Sabah lies south of the typhoon belt, but not beyond its reach. A typhoon passing over or near the Philippines can drag strong winds, heavy rain and rough seas across East Malaysia for a few days, an effect Malaysian forecasters call the typhoon's tail-end, ekor taufan in Malay. Sabah, being closer to the typhoon tracks, is more exposed to it than Sarawak (Tan, Lim and Abdullah, 2013). The best-documented cases struck Sabah's west coast, from Typhoon Ketsana in September 2009 to Tropical Storm Trami in October 2024. These spells last days, not weeks, and vanish in a monthly average, which is one more reason to check a forecast before travelling.
Windward and leeward
Every island has a weather side and a sheltered side, and the sheltered side changes with the monsoon. Resort-based diving takes advantage of that: guides choose sites in the island's wind shadow on rough days. Windward and leeward in the glossary
The background river: the Indonesian Throughflow
Under the wind, the sea is also moving. Water piles up slightly higher in the western Pacific than in the Indian Ocean, and the difference drives a permanent flow from one ocean to the other through the gaps in the Indonesian archipelago. This is the Indonesian Throughflow. Moorings in the main passages measured about 15 million cubic metres of water a second leaving for the Indian Ocean, and 11.6 million of it entering through the Makassar Strait, between Borneo and Sulawesi (Gordon et al., 2010).
Indonesian Throughflow (ITF)
The flow of Pacific water into the Indian Ocean through the Indonesian seas. It runs all year, faster in some months than others, and tidal currents run on top of it. Indonesian Throughflow in the glossary
Switch the map to currents and the routes are visible. The Mindanao Current comes down the east side of the Philippines and turns west into the Celebes Sea. From there the main stream runs south past Maratua and Derawan and down the Makassar Strait, then out through the Lombok Strait and the gaps around Timor. North of Halmahera the currents turn in a large clockwise loop, the Halmahera Eddy, which mixes Pacific water from both hemispheres and passes some of it into the throughflow's eastern route through the Molucca and Banda seas (Kashino et al., 2013). The eddy shifts northwest in the northern summer (Kashino et al., 2013), and on the map the currents around it run more than twice as fast from July to October as in January and February.
What it means at the dive sites
Most of the throughflow travels below the dive zone; the Makassar figure is the flow down to 2,000 metres. Near the top it is seasonal: at 50 metres the moorings recorded the flow slowing to near zero, and at times reversing, in the northwest monsoon, while in the southeast monsoon the Makassar flow at that depth ran at twice the speed of the Timor passage (Gordon et al., 2010). What a diver meets is the surface layer, which also feels the wind. At Maratua the average surface current runs south all year at about 0.8 to 1 knot (1.4 to 1.8 km/h), and is fastest from September to November.
Part of the reason for the winter slowdown is fresh water. In the northwest monsoon, lighter, less salty water from the Java Sea spills into the southern end of the Makassar Strait and holds back the surface layer; in the southeast monsoon that lid lifts (Gordon, Susanto and Vranes, 2003).
Off Mataking and Tun Sakaran, at the edge of the Sibutu Passage, the surface current is more seasonal still. From October to January it averages 1 to 1.4 knots (1.8 to 2.5 km/h) southward, while from March to July it is almost still. In the Dampier Strait the average surface current runs west at about 0.4 knots (0.7 km/h) from June to September and fades for the rest of the year. The tide runs on top of this background flow, so in these channels the tide in one direction is helped along and the tide in the other is held back.
Cold water in the southeast monsoon
Besides raising a swell, the southeast trades push the Banda Sea's surface water away to the northwest, and cooler water from below rises to replace it (Wyrtki, 1961; Gordon and Susanto, 2001). The effect peaks between June and September, so the colder, nutrient-rich water arrives at Ambon and Triton Bay in the same months as their strongest wind. It fades when the wind turns northwest in December. South of Triton Bay, on the shallow shelf of the Arafura Sea, the same monsoon spreads plankton blooms from about 25,000 square kilometres of nearshore water to more than 90,000 (Kämpf, 2016).
Switch the map to water temperature at 30 metres and play through the year to watch it happen. At Ambon the average at that depth falls from 29.4 °C in January to 26.1 °C in August. These are monthly averages from an ocean model, so they smooth out the brief cold surges that temperature loggers record on individual reefs, which can be several degrees colder.
Thermocline and upwelling
The boundary between warm surface water and colder water below. Where wind or current lifts it, divers feel a sudden drop in temperature and often see the water turn green with plankton. Thermocline and upwelling in the glossary
How the clocks stack
Each clock on its own is predictable. What matters on a dive trip is where both stand at once.
Take the Dampier Strait in August. The wind is near its strongest of the year, around 8 knots (15 km/h) on average and almost always from the south, and the background current runs west at about 0.4 knots (0.7 km/h). A spring tide that month, a day or two after the new or full moon, adds the largest tidal flow of the fortnight on top.
Compare Sipadan in May. The wind averages under 6 knots (11 km/h) and is less settled than in either monsoon, the water at 30 metres is around 29 °C, and the open water nearby is at its clearest of the year from March to May. A neap tide that week, around a quarter moon, brings the gentlest tidal flow of the fortnight.
Ambon Bay shows the two clocks working on the same water. A shallow sill separates the inner bay from the outer bay. On the rising tide, water floods in over the sill at an average of about 1.6 knots (3 km/h), more than twice the speed of the ebb, and carries water from below the depth of the sill into the inner bay. This tidal upwelling is most frequent and strongest on spring tides during the southeast monsoon and the transition months (Setyawan, 2024).
None of these examples describes a particular dive. They show which way the odds lean, and the next section sets out where they lean for each destination.
Month by month
| Destination | Windiest | Least settled wind | Water at 30 m | Clearest open water | Murkiest | Closures |
|---|---|---|---|---|---|---|
| Lankayan | Dec to Feb, up to 10 kt (19 km/h) from the northeast | May, Sep to Oct | 27.8 °C (Feb) to 30.0 °C (Oct) | Mar to Apr, Aug | Dec to Feb | Resort closed Jan and Feb |
| Sipadan, Mabul, Kapalai | Jan to Feb from the north; Aug from the south | May, Oct to Nov | 28.2 °C (Feb) to 29.5 °C (Oct) | Mar to May | Dec to Jan | Sipadan closed to divers in Nov |
| Tun Sakaran, Mataking, Pom Pom | Jan to Feb; Aug | May, Oct to Nov | 27.9 °C (Feb) to 29.5 °C (Oct) | Apr to Jun | Dec to Feb | |
| Derawan, Maratua | Jan to Feb; Aug | May, Oct to Nov | 28.1 °C (Aug) to 29.2 °C (Nov) | Jun to Sep | Dec to Feb | |
| Lembeh (open sea outside the strait) | Jul to Sep from the south | Apr to May, Nov | 27.9 °C (Aug) to 29.0 °C (Nov) | Apr, Nov to Dec | Jul to Sep | |
| South Halmahera | Light all year | Apr to May, Oct | 27.9 °C (Aug) to 29.7 °C (Apr) | Feb to Apr | Jun to Aug | |
| Central Raja Ampat | Jul to Sep from the south | Mar to May | 28.8 °C (Mar) to 29.5 °C (Nov) | Jul to Sep | Jan to Feb | |
| Ambon | Jun to Aug, up to 13 kt (24 km/h) from the southeast | Apr, Nov | 26.1 °C (Aug) to 29.4 °C (Jan) | Jan to Mar | Jul to Sep | |
| Triton Bay | Jun to Aug, up to 11 kt (20 km/h) from the southeast | Apr, Nov to Dec | 25.3 °C (Aug) to 29.5 °C (Jan) | Dec to Mar | Jun to Aug | Resort closed in the southeast monsoon |
Wind is the ERA5 average for 1991 to 2020; “least settled” marks the months when the wind most often changes direction. Water temperature at 30 metres is the GLORYS12V1 ocean reanalysis average for 1993 to 2020. Clarity comes from satellite measurements of how quickly light fades in the surface water (Copernicus GlobColour, 1998 to 2020): it compares months at the same destination, describes the open water nearby rather than a particular reef, and is not a visibility figure. Closures are as stated by the resorts.
Two patterns stand out. The Banda Sea pair, Ambon and Triton Bay, has by far the largest swing: from June to September the water at 30 metres is 3 to 4 °C cooler than in January, and the open water loses about half its clarity, as the southeast monsoon drives upwelling. The Sabah destinations change much less, with about 1.5 °C between their coolest month, February, and their warmest, October.
Monthly averages also smooth over short events. Temperature loggers kept on reefs across the Bird's Head Seascape since 2005, at 1 to 3 metres and 15 to 20 metres, recorded upwelled water as cold as 19.3 °C, including at the eastern end of the Dampier Strait and in Triton Bay, and sites such as Cape Kri and the Kri reef flat saw repeated swings of 6 to 12 °C (Huffard et al., 2012). A month that averages 29 °C at 30 metres can still produce a cold dive.
By region
Each destination guide covers its sites, its seasons and how to get there. This table places them on the two clocks.
| Destination | Water body | Monsoon notes | Guide |
|---|---|---|---|
| Lankayan | Sulu Sea | Windiest in the northeast monsoon; the resort closes in January and February | Lankayan guide |
| Sipadan, Mabul, Kapalai | Celebes Sea | Wind from the north in January and February, from the south in July and August; Sipadan closes to divers through November each year | Sipadan guide |
| Tun Sakaran, Mataking, Pom Pom | Celebes Sea, Sibutu Passage | As Sipadan; the strongest surface current of the year runs south from October to January | Tun Sakaran guide |
| Derawan, Maratua | Makassar Strait approaches | Throughflow runs south all year, fastest September to November | Derawan guide |
| Lembeh | Molucca Sea | Strait sheltered from both monsoons | Lembeh guide |
| South Halmahera | Halmahera Sea | Light wind all year | South Halmahera guide |
| Central Raja Ampat | Dampier Strait | Windiest in July and August; the central islands shelter the strait | Central Raja Ampat guide |
| Ambon | Banda Sea | Strong southeasterlies from June to September, the season of Banda Sea upwelling | Ambon guide |
| Triton Bay | Banda and Arafura seas | Southeast monsoon closes the resort; season runs from late September to early June | Triton Bay guide |
Before you travel
Everything above describes the usual pattern. For the week of a trip, the national forecasts give the actual wind and sea state: the Malaysian Meteorological Department for Sabah, including its strong-wind and rough-sea warnings, and Indonesia's BMKG marine forecast for Indonesian waters. A local tide table gives the time of high and low water. For the time of slack water in a channel, ask the dive guides.
Sources
Research
- Bowers, D. G. and Roberts, E. M. (2019). Tides: A Very Short Introduction. Oxford University Press. Chapter 1 (springs and neaps, age of the tide, diurnal inequality, equinoctial tides, fast currents in straits) and chapter 4 (progressive and standing waves, slack water).
- Gordon, A. L. and Susanto, R. D. (2001). Banda Sea surface-layer divergence. Ocean Dynamics, 52, 2–10. doi:10.1007/s10236-001-8172-6
- Gordon, A. L., Susanto, R. D. and Vranes, K. (2003). Cool Indonesian throughflow as a consequence of restricted surface layer flow. Nature, 425, 824–828. doi:10.1038/nature02038
- Gordon, A. L., Sprintall, J., Van Aken, H. M., et al. (2010). The Indonesian throughflow during 2004–2006 as observed by the INSTANT program. Dynamics of Atmospheres and Oceans, 50(2), 115–128. doi:10.1016/j.dynatmoce.2009.12.002
- Huffard, C. L., Wilson, J., Hitipeuw, C., Rotinsulu, C., Mangubhai, S., Erdmann, M. V., Adnyana, W., Barber, P., Manuputty, J., Mondong, M., Purba, G., Rhodes, K. and Toha, H. (2012). Ecosystem based management in the Bird's Head Seascape: turning science into action. Ecosystem Based Management Program: Conservation International, The Nature Conservancy and WWF Indonesia. Section 4, Sea surface temperature patterns of the BHS.
- Kämpf, J. (2016). On the majestic seasonal upwelling system of the Arafura Sea. Journal of Geophysical Research: Oceans, 121, 1218–1228. doi:10.1002/2015JC011197
- Kashino, Y., Atmadipoera, A., Kuroda, Y. and Lukijanto (2013). Observed features of the Halmahera and Mindanao Eddies. Journal of Geophysical Research: Oceans, 118, 6543–6560. doi:10.1002/2013JC009207
- Ray, R. D., Egbert, G. D. and Erofeeva, S. Y. (2005). A brief overview of tides in the Indonesian seas. Oceanography, 18(4), 74–79. doi:10.5670/oceanog.2005.07
- Setyawan, W. B. (2024). Estimating the response of mangrove ecosystems in highly protected bay environments in urban areas to sea level rise: case from Inner Ambon Bay, Ambon Island, Indonesia. International Journal of Conservation Science, 15(4), 1931–1946. doi:10.36868/IJCS.2024.04.23
- Tan, F., Lim, H. S. and Abdullah, K. (2013). Effects of orography on the tail-end effects of Typhoon Ketsana. The Open Atmospheric Science Journal, 7, 14–28. Full text
- Wyrtki, K. (1961). Physical Oceanography of the Southeast Asian Waters. NAGA Report vol. 2. Scripps Institution of Oceanography.
- Yosi, M., Gerhaneu, N. Y., Permanawati, Y., Suherman, I. H., Raharjo, P. and Ilahude, D. (2023). Penentuan lokasi turbin pembangkit listrik tenaga arus laut skala kecil di perairan Selat Lembeh, Bitung Sulawesi Utara. Jurnal Geologi Kelautan, 21(1). doi:10.32693/jgk.21.1.2023.777
- Malay Mail (26 October 2024). MetMalaysia: Tropical Storm Trami to unleash heavy rain and strong winds on northern, eastern coasts of Peninsula, western Sabah. Article
Data
- Wind: ERA5 monthly averaged data on single levels, 1991–2020 (Hersbach et al., 2020, Quarterly Journal of the Royal Meteorological Society, 146, 1999–2049, doi:10.1002/qj.3803). Copernicus Climate Change Service Climate Data Store, doi:10.24381/cds.f17050d7.
- Currents and sea temperature: Global Ocean Physics Reanalysis (GLORYS12V1), 1993–2020. Copernicus Marine Service, doi:10.48670/moi-00021.
- Water clarity: Global Ocean Colour (Copernicus-GlobColour) L4 monthly KD490, 1998–2020. Copernicus Marine Service, doi:10.48670/moi-00281.
- Coastline: Natural Earth.
Contains modified Copernicus Climate Change Service information (2026) and E.U. Copernicus Marine Service information. Neither the European Commission nor ECMWF is responsible for any use that may be made of the Copernicus information or data it contains. Analysis, map and diagrams by Asia Diving Vacation.